Make sense of your
graph| data
Analytics for Unstructured Data
See your data, find patterns and anomalies, collaborate with your team, ask AI questions, and more.
Showcase
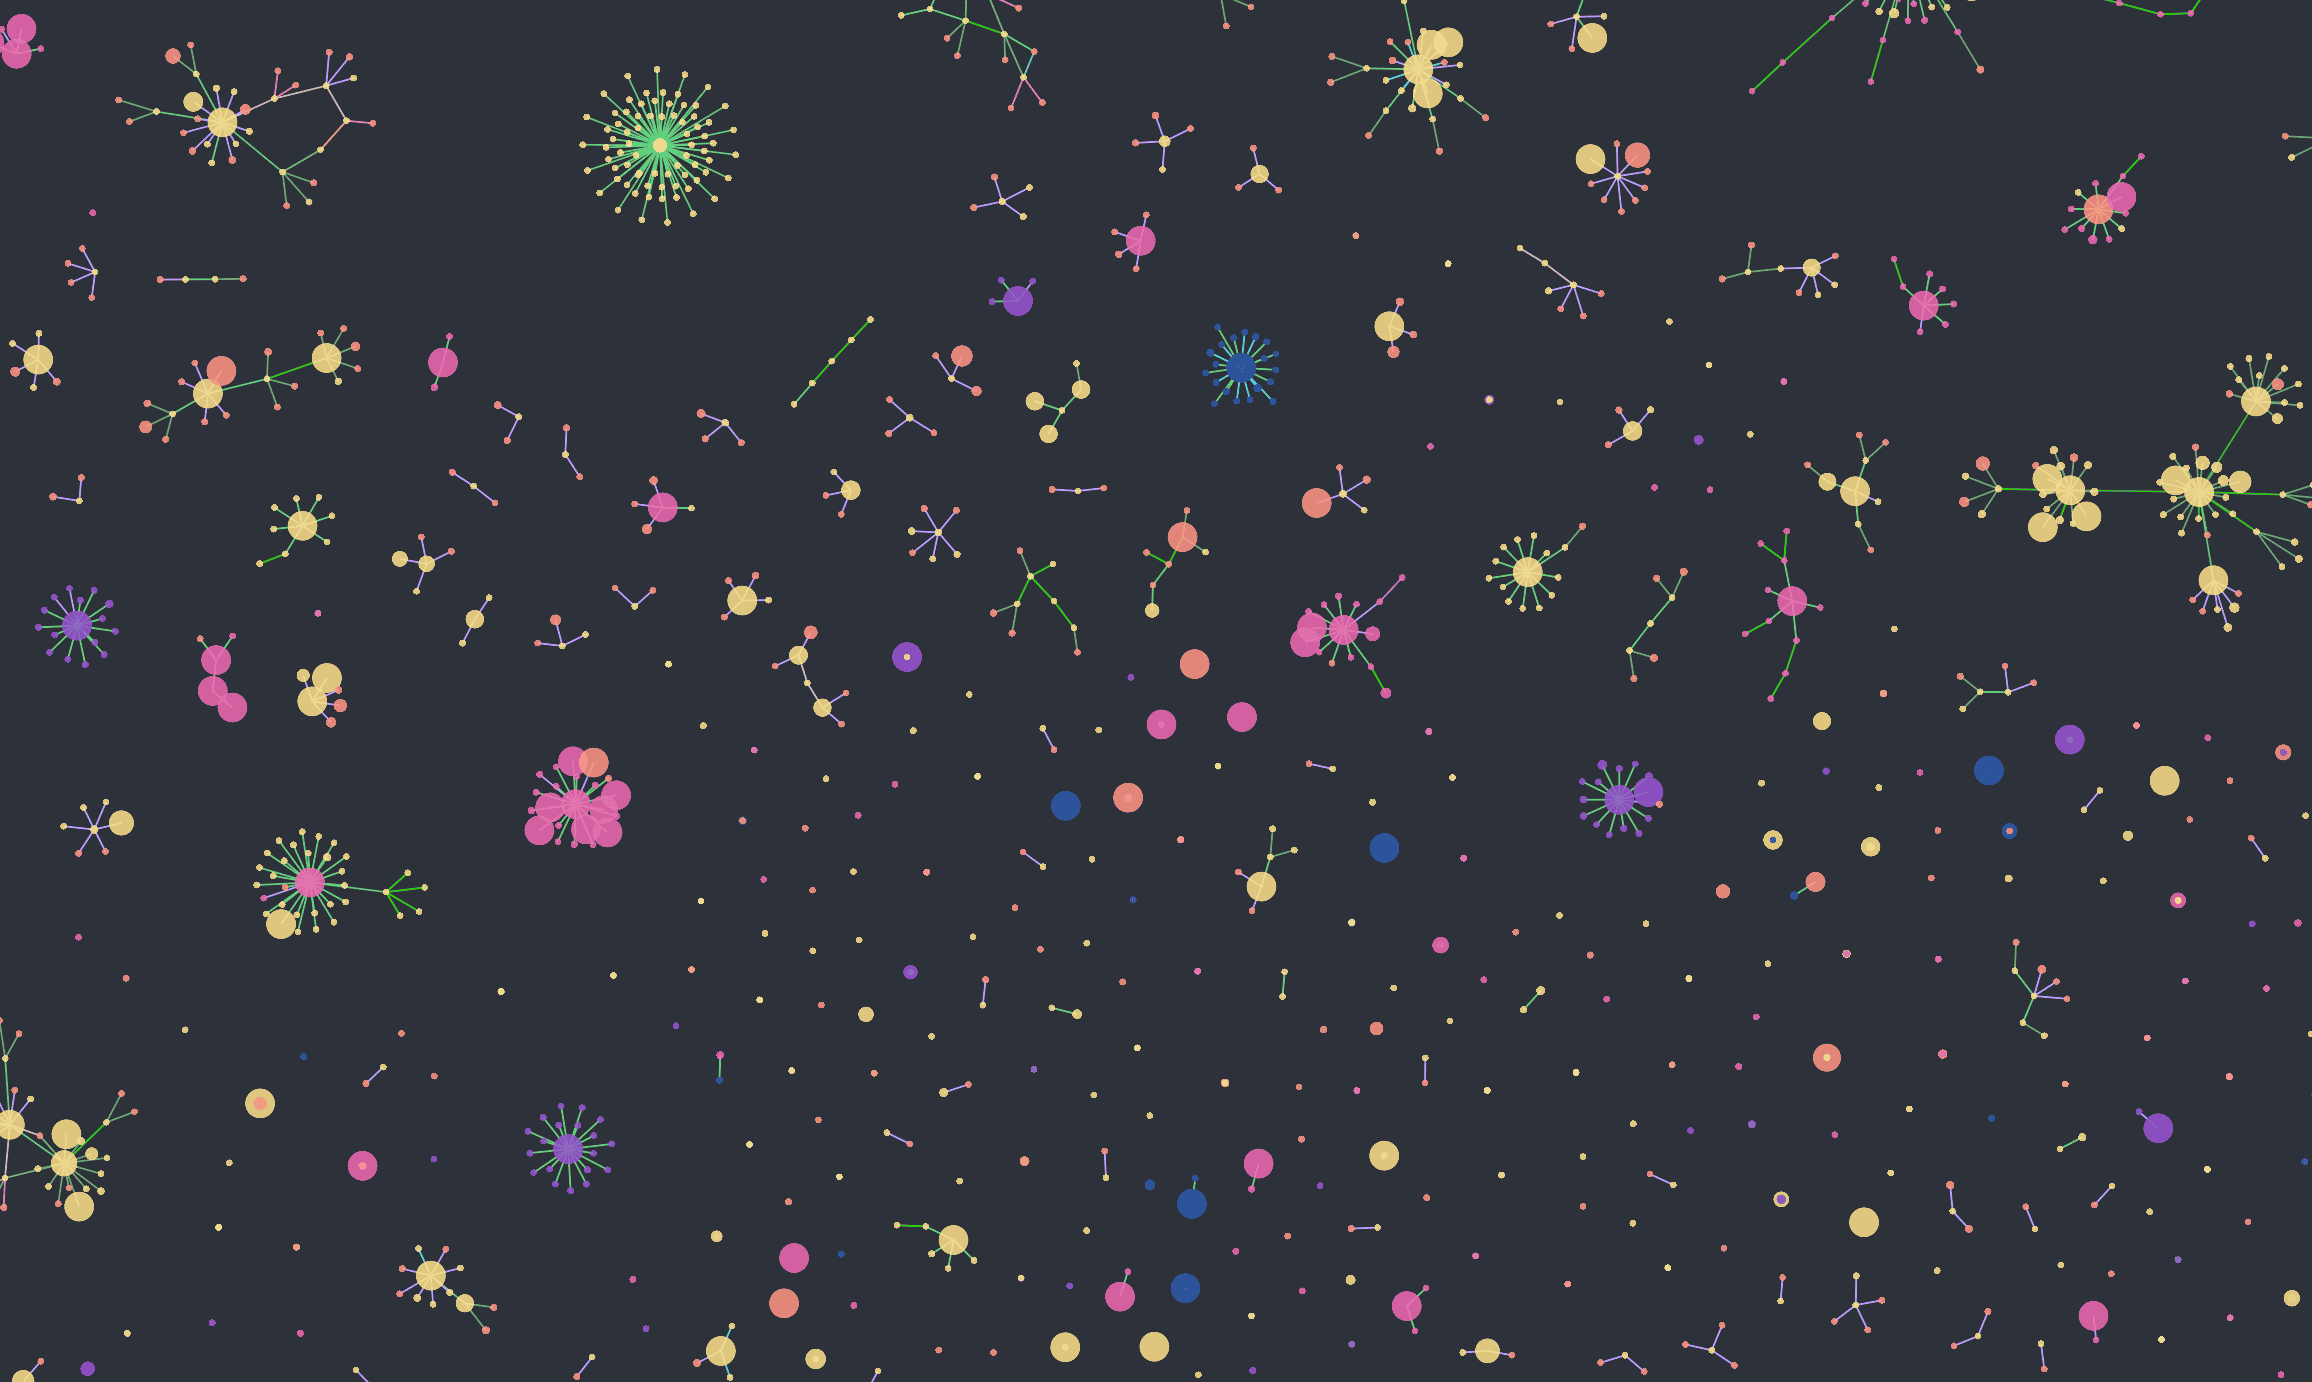
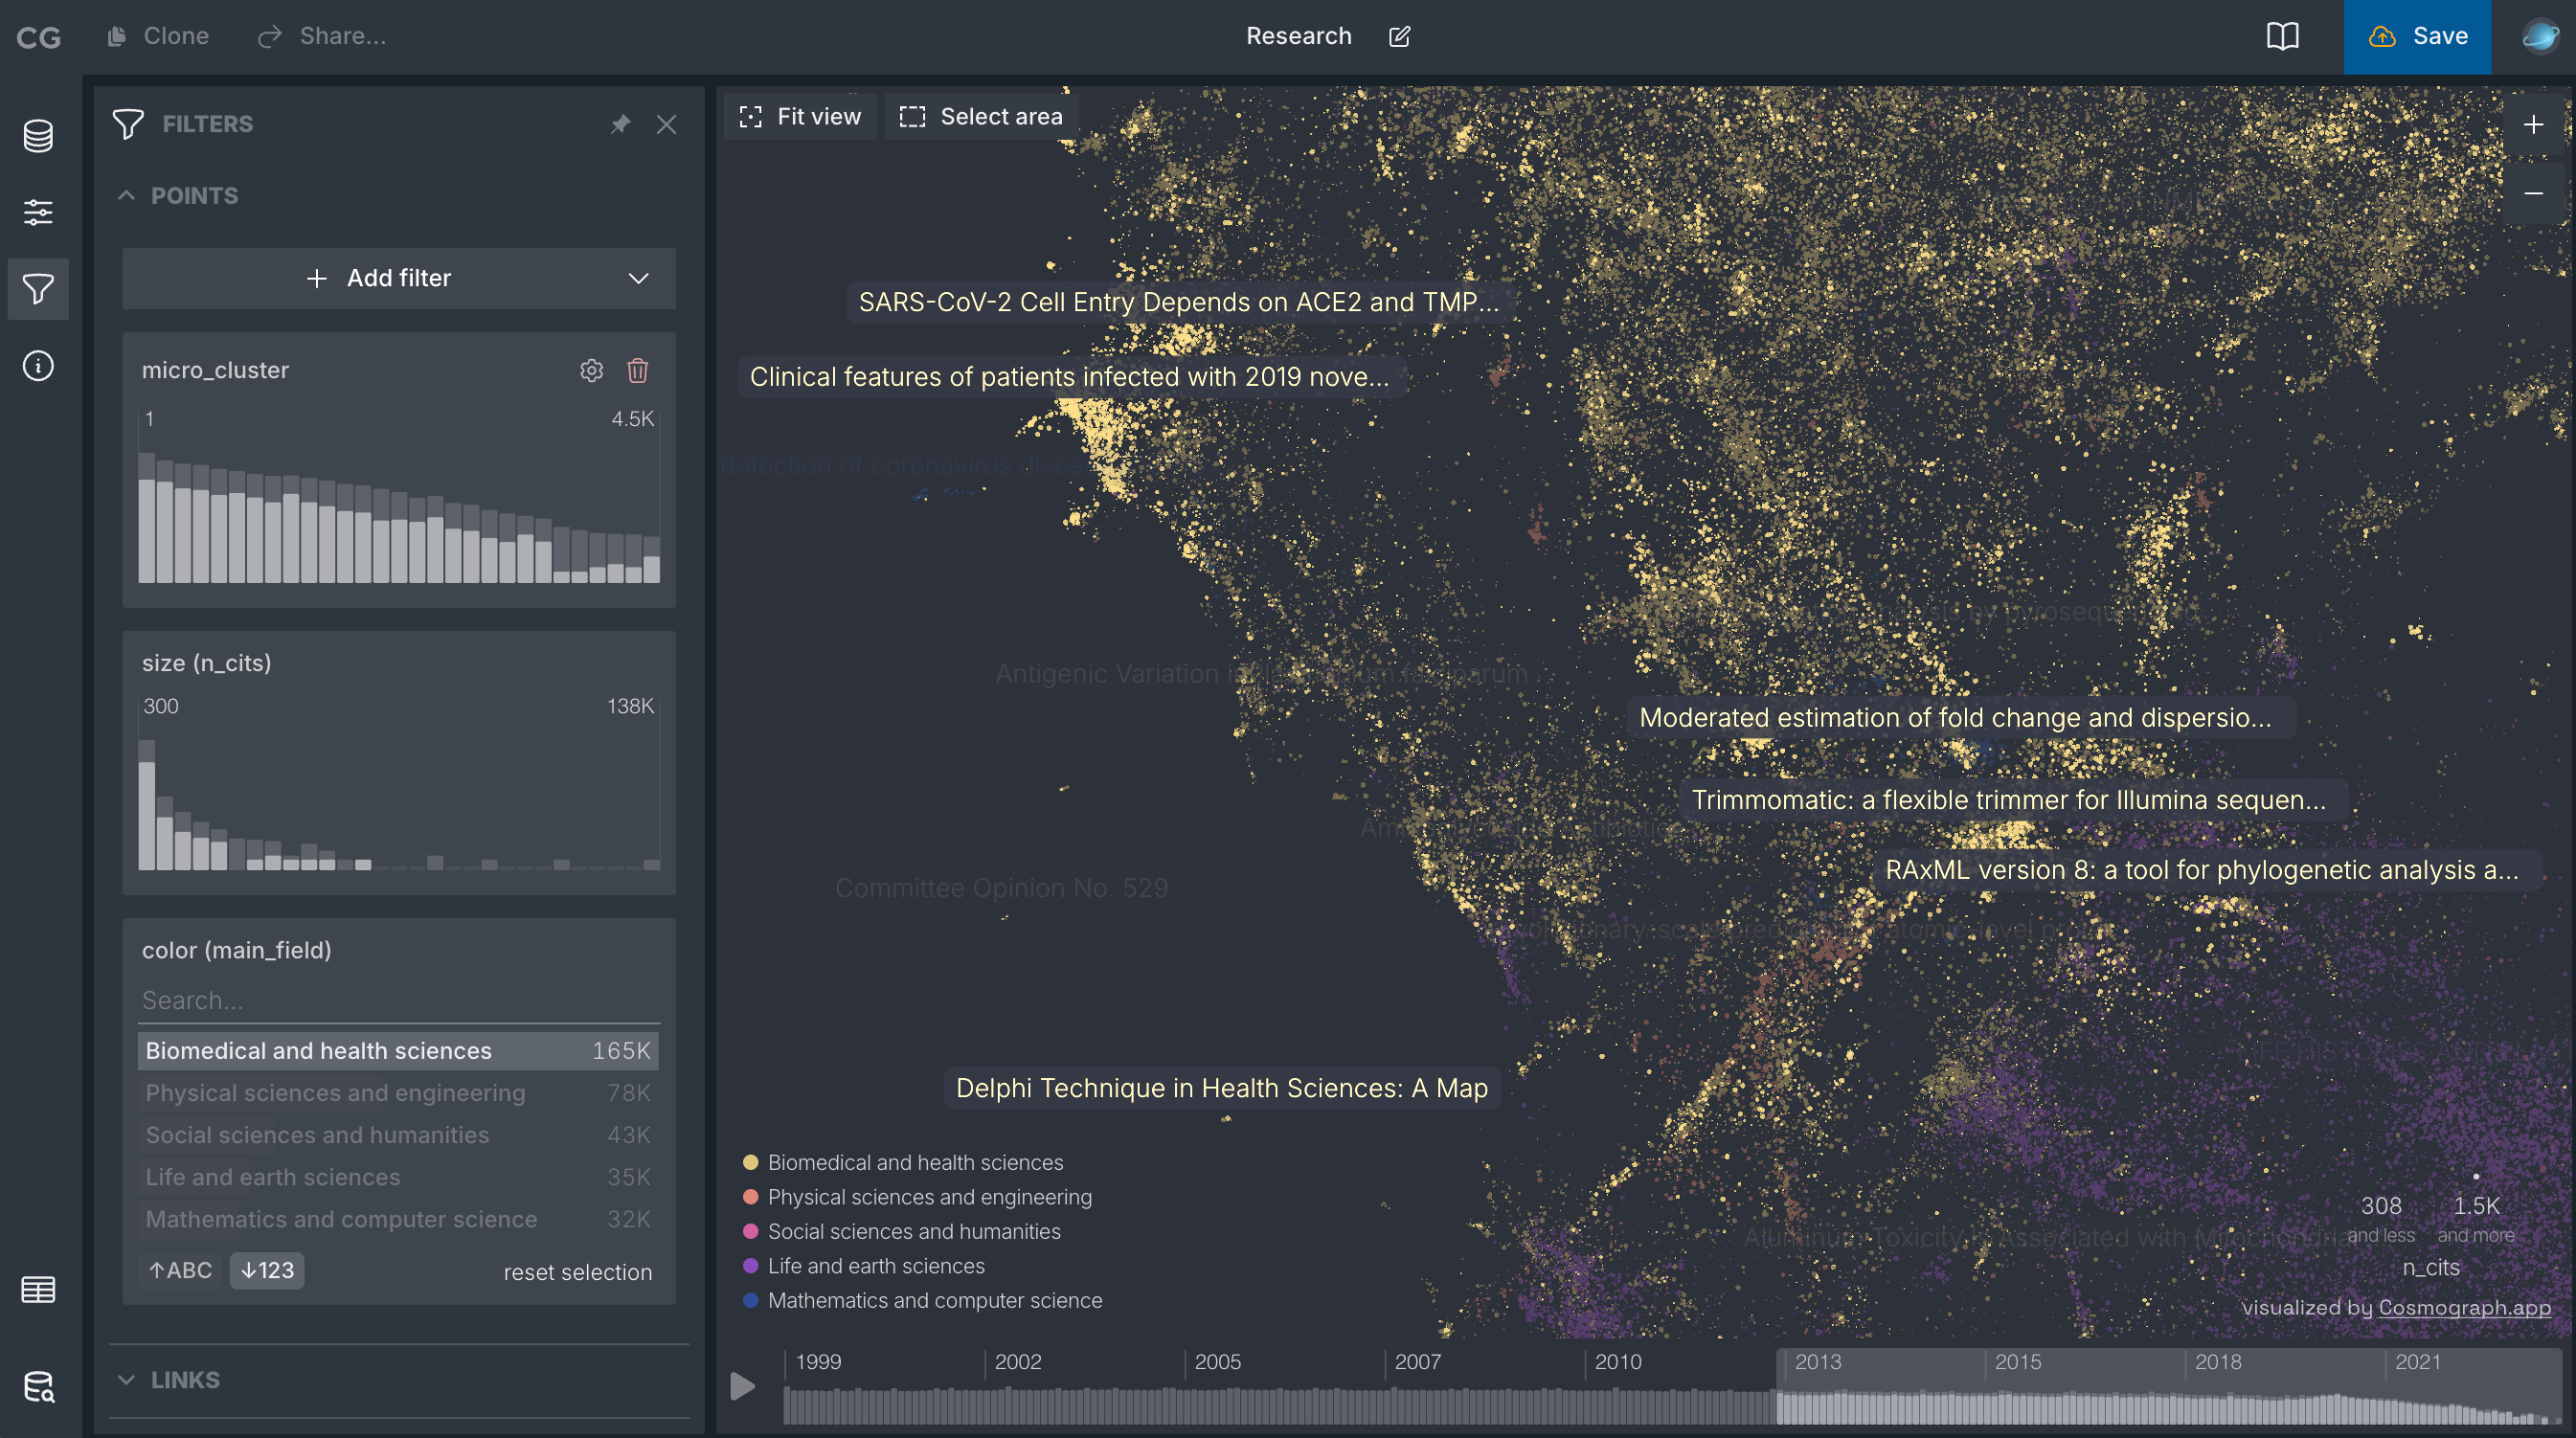
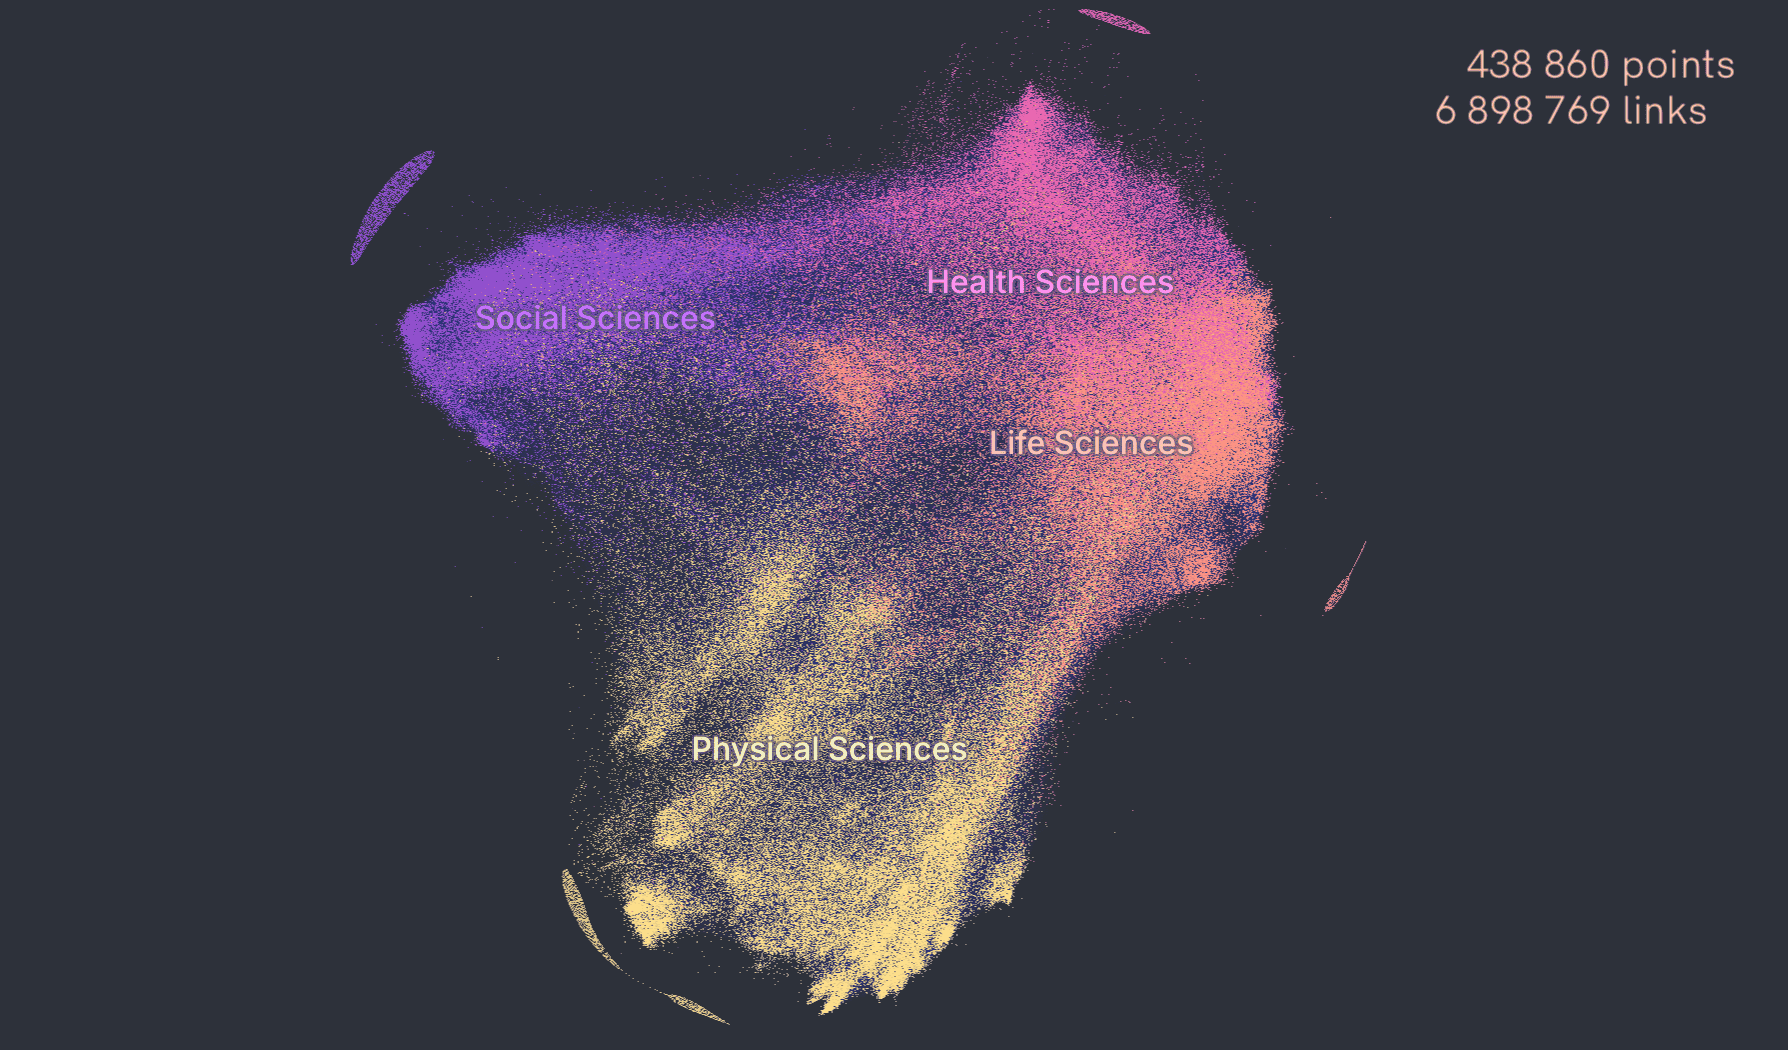
AI Model Atlas
Model Atlas visualizes entire populations of machine-learning models as an interconnected graph, showing how models evolve, relate, and transform through fine-tuning. Learn more at horwitz.ai/model-atlas.
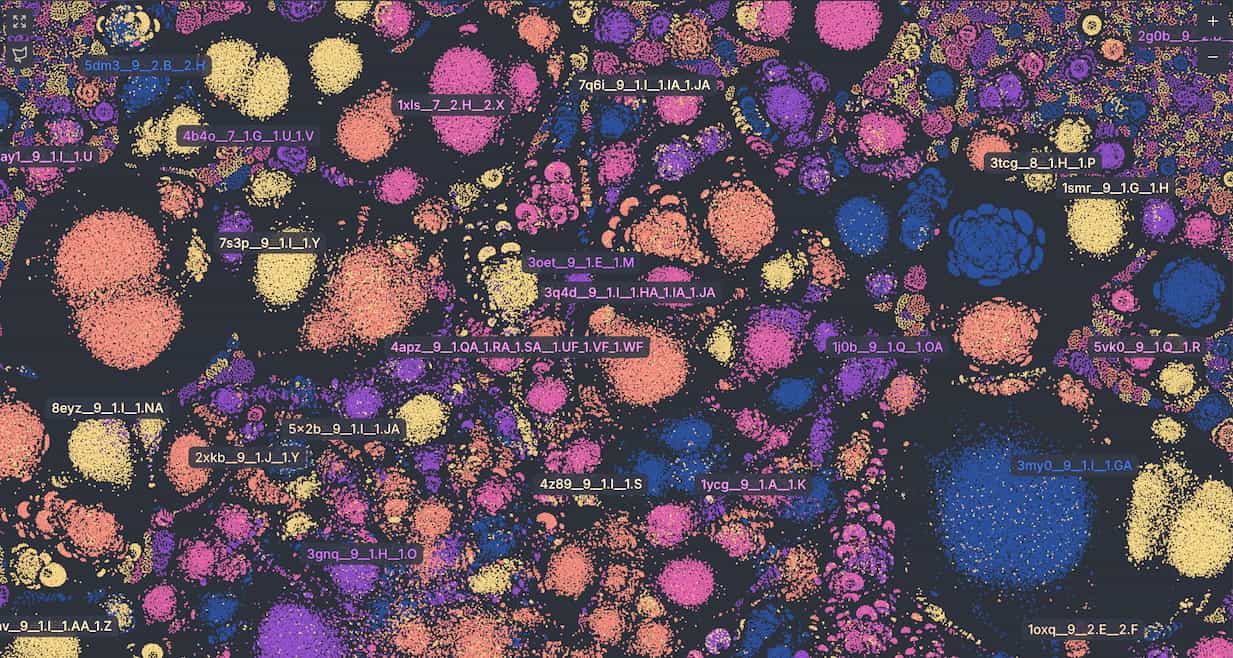
PLINDER
Interactive atlas of protein–ligand systems. Each point represents a Plinder system positioned by shared interaction patterns. Learn more at plinder.sh.
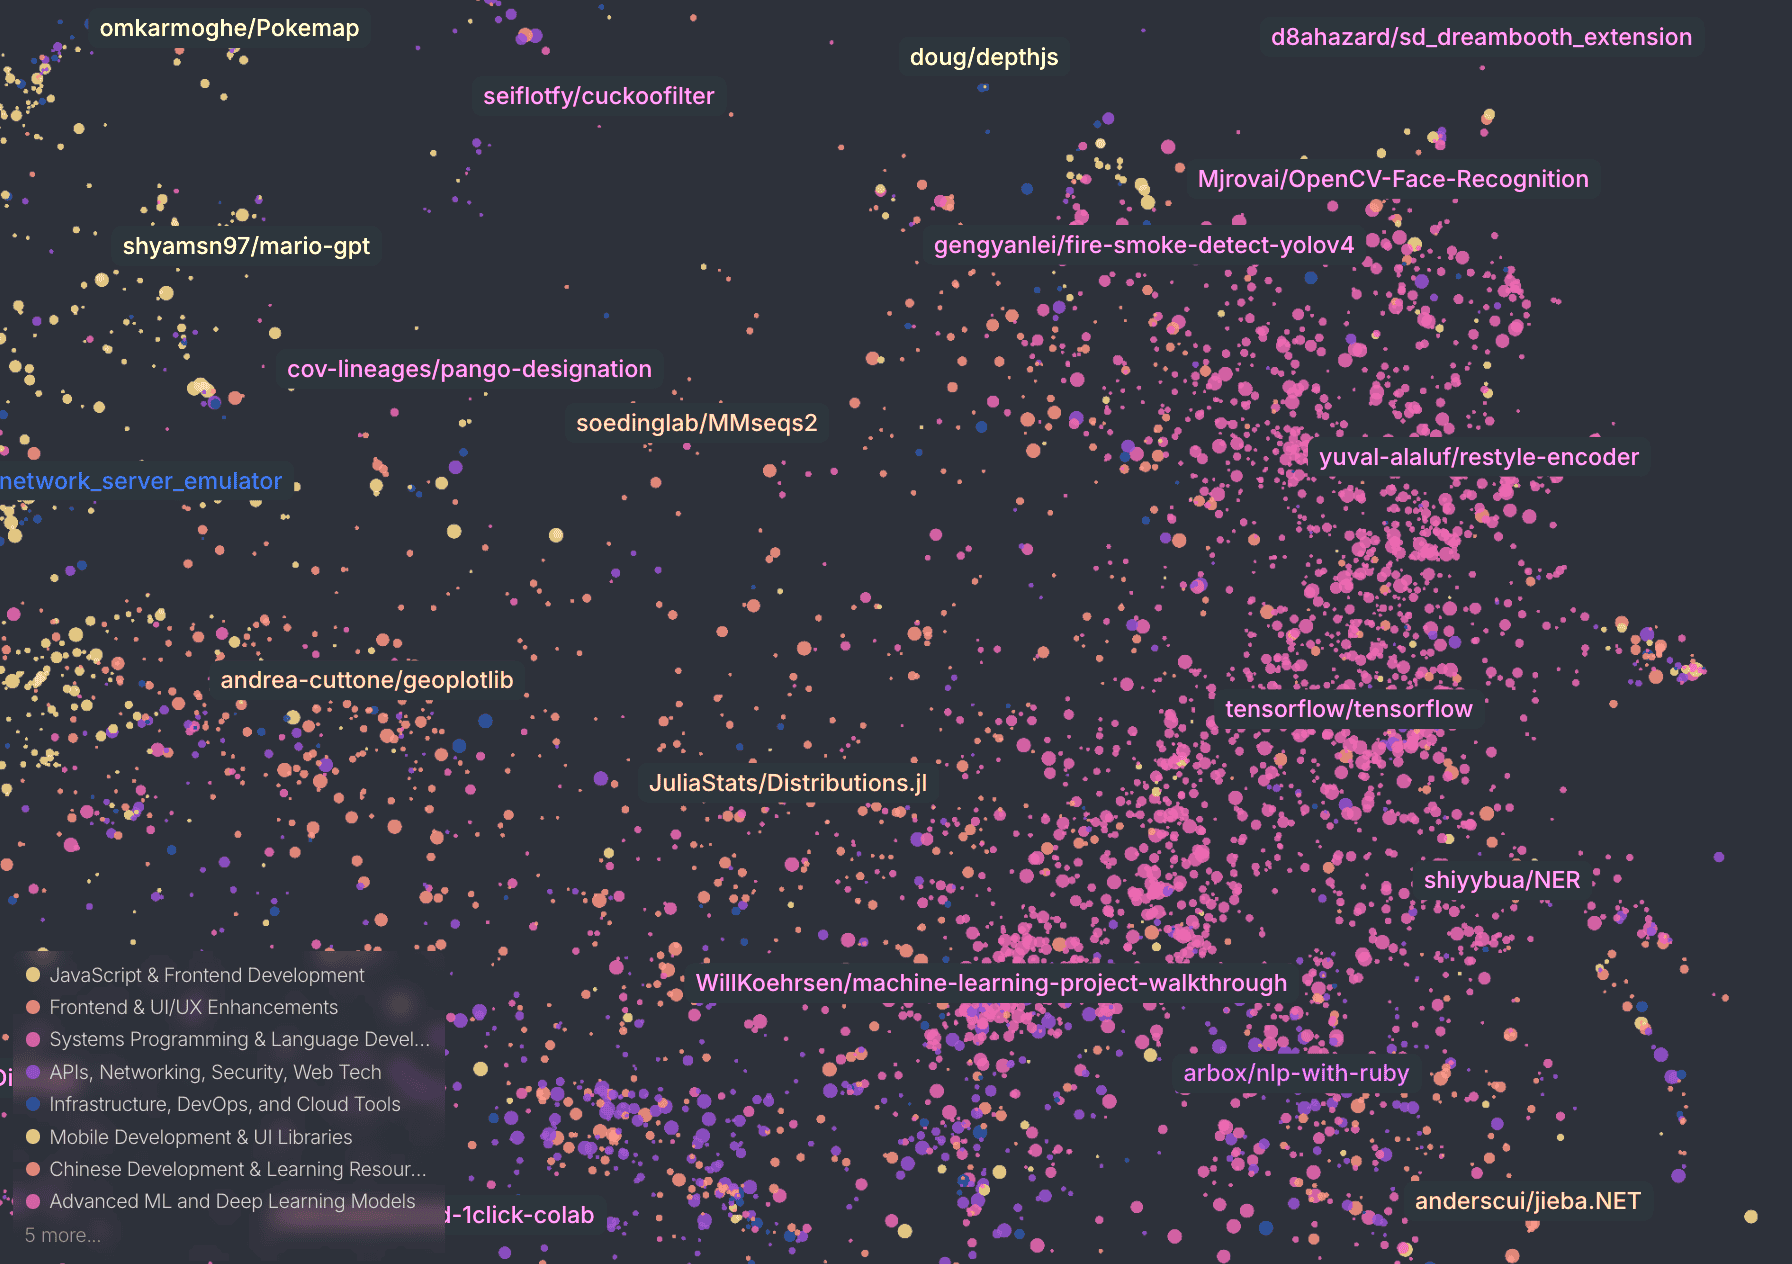
Map of GitHub
Semantic map of GitHub repositories. Each point represents a repository positioned by repo description.
Why people love Cosmograph
The fastest single-node graph analytics toolkit
The fastest web-based force network graph layout and rendering. Working with massive datasets. Built on top of DuckDB (the fastest in-memory analytics database).
Privacy-first
Your data stays local unless you decide to share it
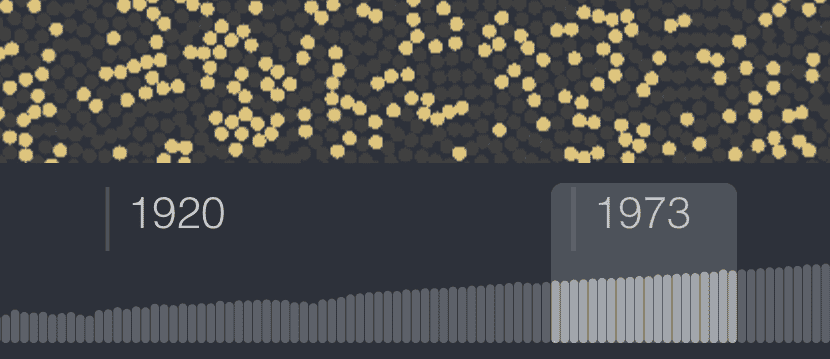
Time dimension
See you dataset evolving over time with the help of the Timeline
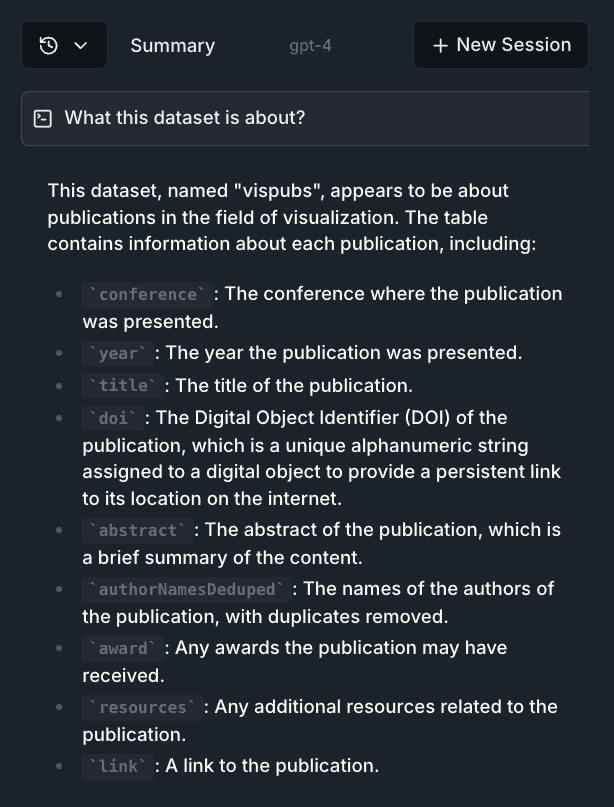
Chat with your dataclosed beta
Ask AI questions about your data and get answers in real-time
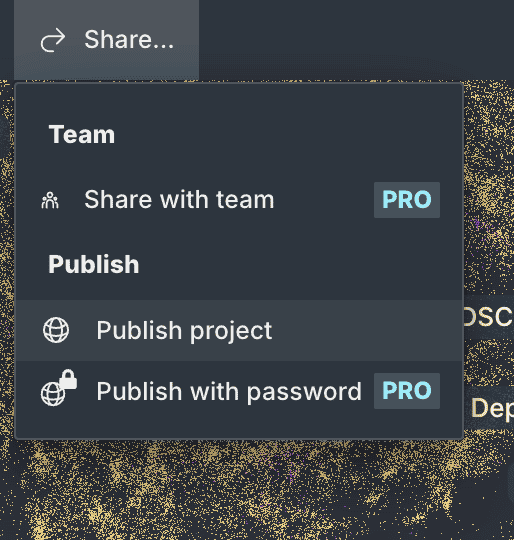
Graph sharing
Easily share your graph with colleagues or integrate it directly into your website.
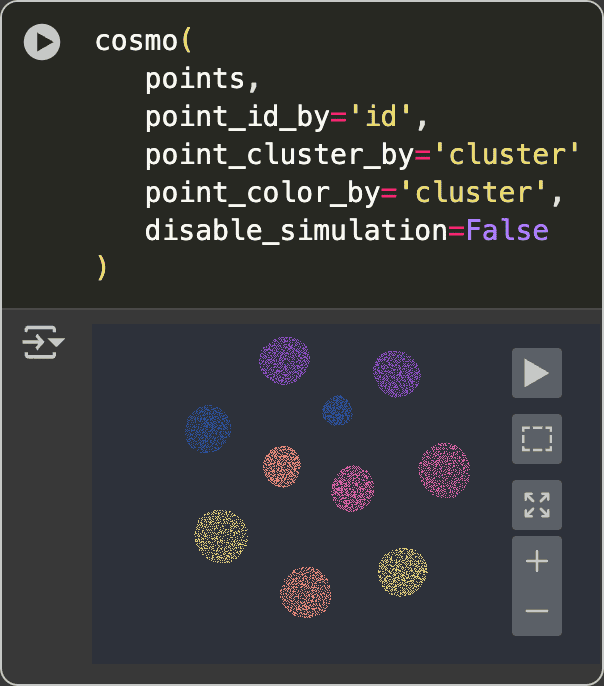
By data analysts, for data analysts
Start in Python notebook, continue in the browser, build your web app with our library!
Collaborationclosed beta
Work with your team on the same graph
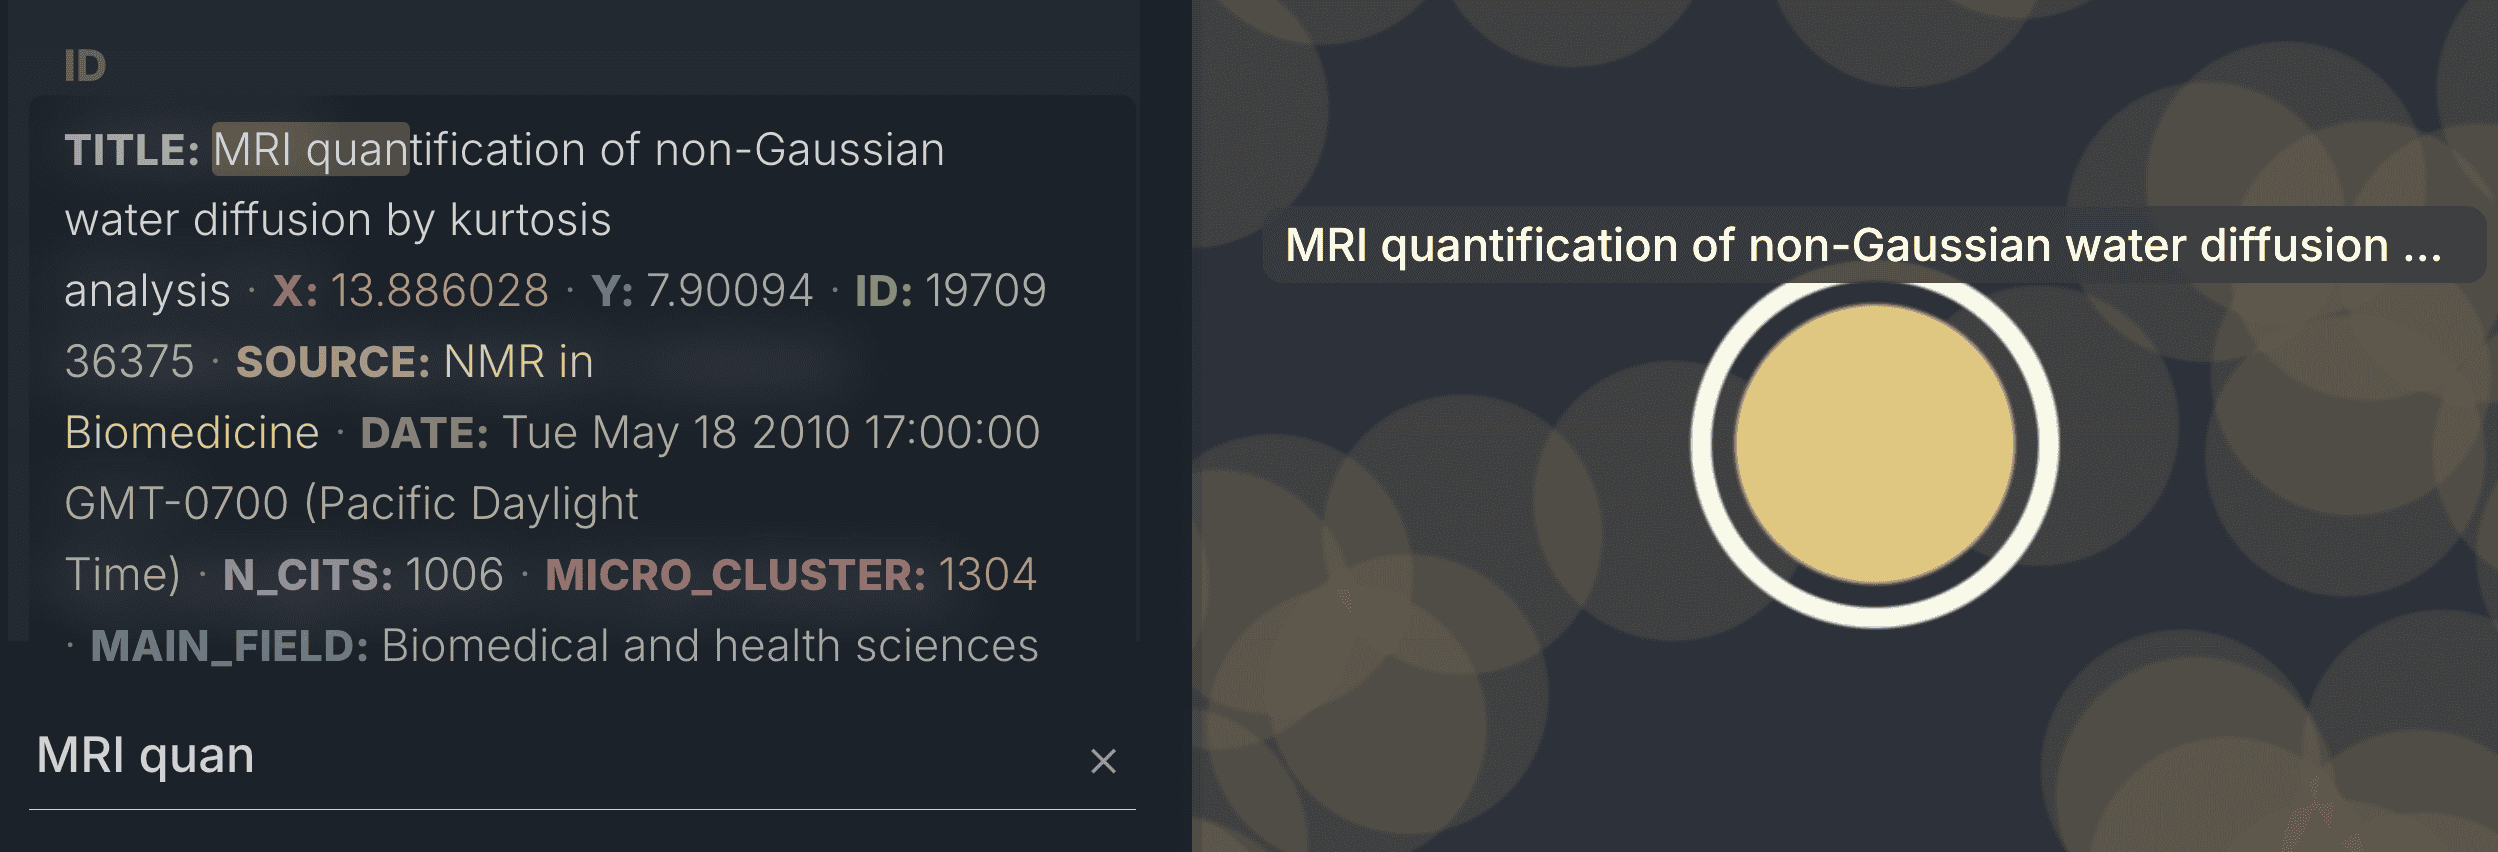
Powerful filtering & search
Filter your data through histograms, strip away noise, and spot the needle in the haystack: distributions, outliers, patterns.
Trusted by top researchers and engineers
Web developer?
Try Cosmograph library!
Want to add Cosmograph capabilities into your own project?
Check out our React and JavaScript library.
 Try examples
Subscribe to updates
Subscribe to be the first to learn about new updates, features and discounts